Percentiles
Terms like — p95, p90, p99, etc. — refer to percentiles in a dataset.
Here’s what they mean simply:
| Term | Meaning | Example (Response Time ms) | Interpretation |
|---|---|---|---|
| p50 | 50th percentile (median) | 200 ms | 50% of requests are faster than 200 ms |
| p90 | 90th percentile | 400 ms | 90% of requests are faster than 400 ms (10% are slower) |
| p95 | 95th percentile | 500 ms | 95% of requests are faster than 500 ms (5% are slower) |
| p99 | 99th percentile | 900 ms | 99% of requests are faster than 900 ms (1% are very slow) |
💡 In performance monitoring
Percentiles are used to understand tail latency or worst-case behavior — not just the average.
For example:
-
Average (mean) latency might be 200 ms,
-
But p95 = 600 ms → means 5% of users experience much slower responses.
🧠 Quick takeaway
-
p50 → typical user experience
-
p90/p95 → “almost all” users’ experience
-
p99 → rare but important slow cases
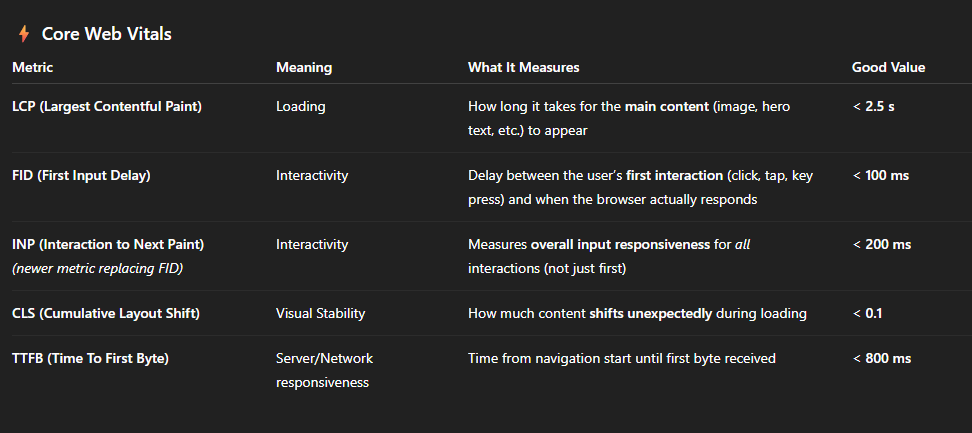
For example, here are the core web vitals
Here is a typical Azure AppInsights KQL query for Web Vitals
customMetrics
| where name in ("WebVital_TTFB", "WebVital_LCP", "WebVital_FID", "WebVital_INP", "WebVital_CLS")
| summarize
    p50 = round(percentile(value, 50), 0),
    p75 = round(percentile(value, 75), 0),
    p90 = round(percentile(value, 90), 0),
    p95 = round(percentile(value, 95), 0),
    p99 = round(percentile(value, 99), 0)
    by name